In Microsoft excel a Chart is a built-in tool
that allows you to display data in a different chart and graphs formats
such as Column, Line, Pie, Bar, Area, X.Y Scatter, Stock, Surface, Doughnut,
Bubble and Radar. These
charts and graphs help you understand the data in a worksheet by displaying easy
analyze from, although we can also see it in sheet but that is a little bit
difficult to analyze from the data.
Select the Excel chart
or graph format that is best fits your work
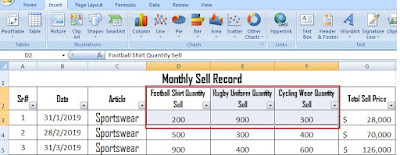
Please see the below image Insert >Charts.
 |
| how to create a chart in ms excel |
What is Column Chart
 |
| Column Chart |
A column chart is used to compare value across categories. The Column Chart shows a comparison of one or more series of
data points. Such as you can see the monthly sell graph that is showing the
difference between month sell. High sell showing the tallest graph and lowest sell
showing the lowest graph.
 |
| column chart in ms excel |
What is Line Chart
A line
chart is mostly used for showing trends over time. The lines connect each data
point so that you can see how the value fluctuating, increased or decreased
over a period of month/time.
Such as
in the below chart, you can see the graph of monthly sell.
 |
| how to make a line graph in excel 2007 |
Change Chart Type
You can easily change the applied chart type to a
different types of charts at any time.
On the Design tab, click Change Chart Type and
a new window displayed from here you can
change and select any other needed chart
type.
 |
| how to change chart type |
Also Read:
What Is SmartArt In Excel
What is Pie Chart
A Pie Chart can
only display one series
of data. A data series is a row or column of numbers used for
charting. Excel uses the first
column or row as the chart title.
A pie chart is a
circle that divided the data into slices. Each slices represent the
contribution in a circle base on its value.
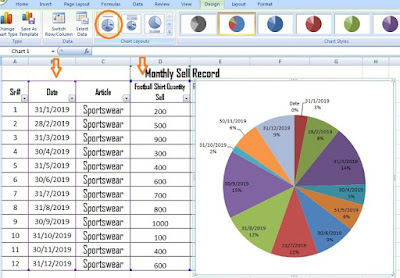
To create a Pie chart on your data sheet select the range and then go to insert >chart use any pie chart subcategory.
You can change the chart name/title. Click on the Chart Title section at the top of the graph and change the title. Now drag anywhere and save it.
If you want to delete the chart place your cursor on the edge of the chart and press your Delete key.
 |
| how to add pie chart in excel |
 |
| Pie chart with row range |
 |
| Pie chart with columns range |
What Is Bar Chart
A Bar Chart is a graph that similar to a Column Chart. A bar chart can be used to compare the multiple values in a worksheet. The best uses of the bar chart are when the value on the chart represents duration or when the text is too long.To make a Bar chart, first we have selected columns B, D, E from our sheet and Click on the Insert tab & then on Bar Chart from the Charts group. You will see many options here when you select this button, such as 2-D, 3-D, cylinder, Cone, Pyramid. For our worksheet, we have selected 2-D columns. The chart will appear. You'll also see horizontal bars giving the names of your headers at the left of your graph.
 |
| how to make a bar chart in excel with multiple data |
You
can change the chart name/title. Click on the Chart Title section
at the top of the graph and change the title. Now drag anywhere and save it.
If
you want to delete the chart place your cursor on the edge of the chart and press your Delete key.
Further, you can redesign your graphs by using other options. Just go to the Design tab or double click on
chart edges it will directly go there. Such as in the below image you can see
we have applied next layout 5 from chart layouts.
 |
How to draw a simple bar chart in excel |
An
area chart is similar to a line chart but with one difference. The area below
the line in graphs is filled with colours. Area Charts are used primarily to show trends over time or other
category.
To apply the Area chart, first select the range and
choose the Area chart and next to any sub-category.
 |
| How to create an area graph in excel |
You will see many options here when you select this button, such as 2-D,
3-D area. For our worksheet, we have selected 3-D Area and next layout 7.
 |
| Excel 2007 Area chart |

No comments:
Post a Comment